Visualization
Generate a deployment diagram from a program or its IR:
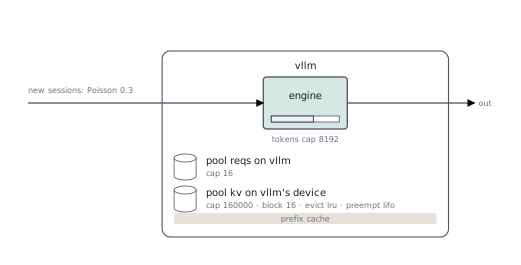
The deployment view shows stages, memory pools, instance boundaries and request flow. Drawing does not run the simulation; the same IR produces the same diagram.
Experimental notation
Diagram notation, options and output may change between releases.
Formats
- TikZ (default): a
tikzpicturefor a LaTeX document using\usepackage{tikz}. Include the generated file with\input. - SVG: a standalone image with light- and dark-mode colors.
Output goes to stdout unless --out names a file. --set and --def
apply the same overrides as for simulation. Python's
pyserq.draw returns the diagram as text.
See the CLI reference for all options.
Limitations
- A pool held in separate places may appear in several frames or enclosures. Its name identifies the shared resource.
- Stations occupy one row; large deployments can produce wide diagrams.
- Long expressions are shortened with
~. - Constants are folded:
cap blocks * bsshows its value rather than the original names. - The deployment view does not show an iteration-by-iteration trace.